Barnard's Star
June 18, 2021
I've been following Barnard's Star
(V2500 Oph) for some years now, and usually take at least a
quick look at it when it's in season and I'm out observing. I
also take a snapshot periodically and here's one I took on
June 18, 2021, from the NJ Pines.
Barnard's Star has the greatest known proper
motion, about 10.3 arc seconds per year compared to the
background sky, which is roughly a Jupiter diameter every four
years.
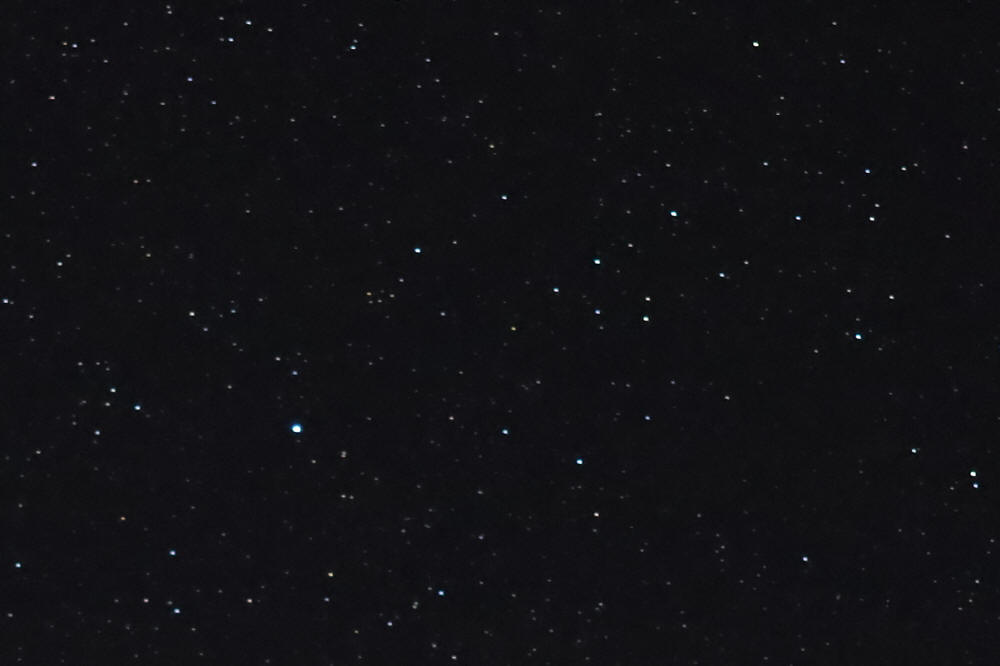
Here's an online article about Barnard's Star at S&T. This image was captured at 1:39 am EDT with a Canon EOS
RP mirrorless digital camera and a Canon 200 mm, f/2.8L
telephoto lens on a fixed tripod. It's a single raw frame
exposed 2 seconds at f/2.8, ISO 8000, 4200K white balance.
Unprocessed, but cropped to 87% of its original linear dimensions for a field
8.9° wide x
5.9° high. Mouseover for labels. The image below is a
further crop for greater enlargement.
Here's more about Taurus Poniatovii.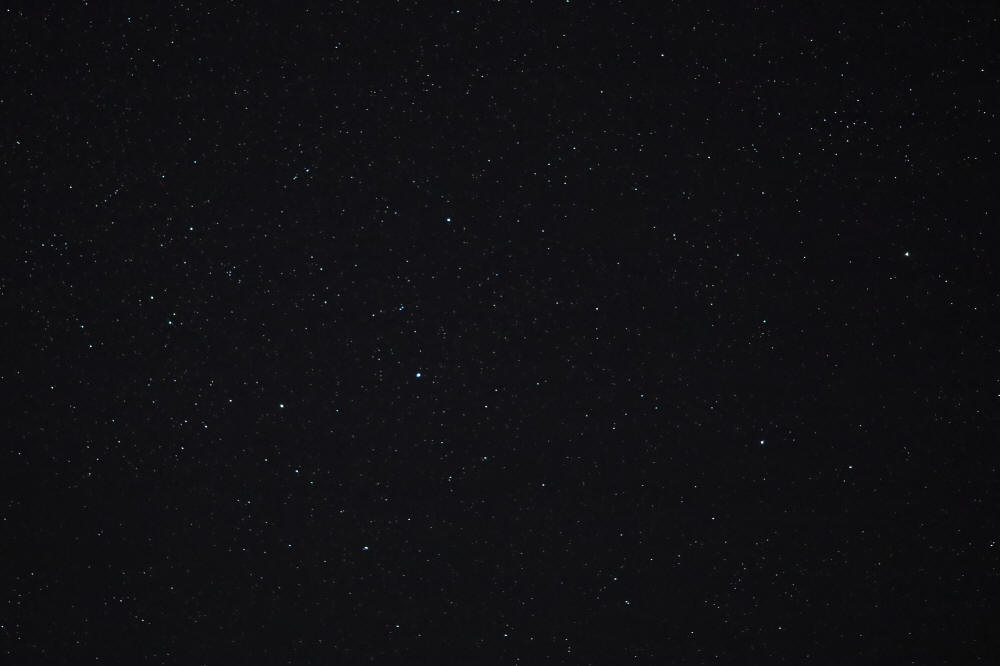
Proper motion detected...
This is the same raw frame as the image above from
June 18, 2021, but cropped to 29% of its original linear dimensions for a field
3.0° wide x
2.0° high. Mouseover for labels. While observing
Barnard's Star visually with the 88 mm spotting scope on June 18, I felt
that the spacing between it and TYC 00425-0262-1 had increased
compared to previous years, but that's very subjective and
qualitative. So, I decided to measure this image and
the one I took in mid-May 2017, which would be an approximate
four-year
time span (actually 49 months), to see if there was any apparent change
that would be indicative of proper motion.
I tried on-screen measurements of the spacing between the TYC
star and Barnard's Star, but it was too clumsy to get reliable
values, so I made a negative of each image, enlarged it and
measured the paper printouts with a
nice Pickett 150 mm metal ruler.
I used SkyTools to measure
the angular span between TYC
00425-0262-1
and HD 163697, the left point of the asterism outlined on mouseover
in the above image (it was 811
arc seconds). The resulting plate scale on those two prints was: 2017
= 64 mm = 12.67"/mm; 2021 = 49 mm = 16.55"/mm.
Next, I
measured the span from the TYC star to Barnard's Star: 12.5 mm in 2017
= 158.4", 12 mm in 2021 = 198.6" (a difference of 40.2").
However, the lines from the TYC star to the positions of
Barnard's Star on the two dates were not superimposed but diverged at a 4.8° angle.
Correcting for that with some basic trigonometry, I calculated the distance between Barnard's
Star on the two dates was 42.87", or
10.50"/year, which is pretty close to
the
Hipparcos astrometric spacecraft's
proper motion value of
10.36"/year.
I also calculated the spans between the
respective stars in the images based on their x,y pixel positions
as shown by Corel PaintShop Pro 2021. That yielded a proper
motion of 39.78" or 9.74"/year.
I haven't figured out why the two measurement techniques yielded
moderately different results, but they
averaged 10.12"/year, still not
too shabby for routine snapshots not intended for precise
measurement (indeed, the trailing of the magnified stars due to
the use of a fixed tripod makes it difficult to assign a
position to be used for measurement). These values were updated on June 28, 2021, after building and
using a spreadsheet to do the calculations without any
intermediate rounding.
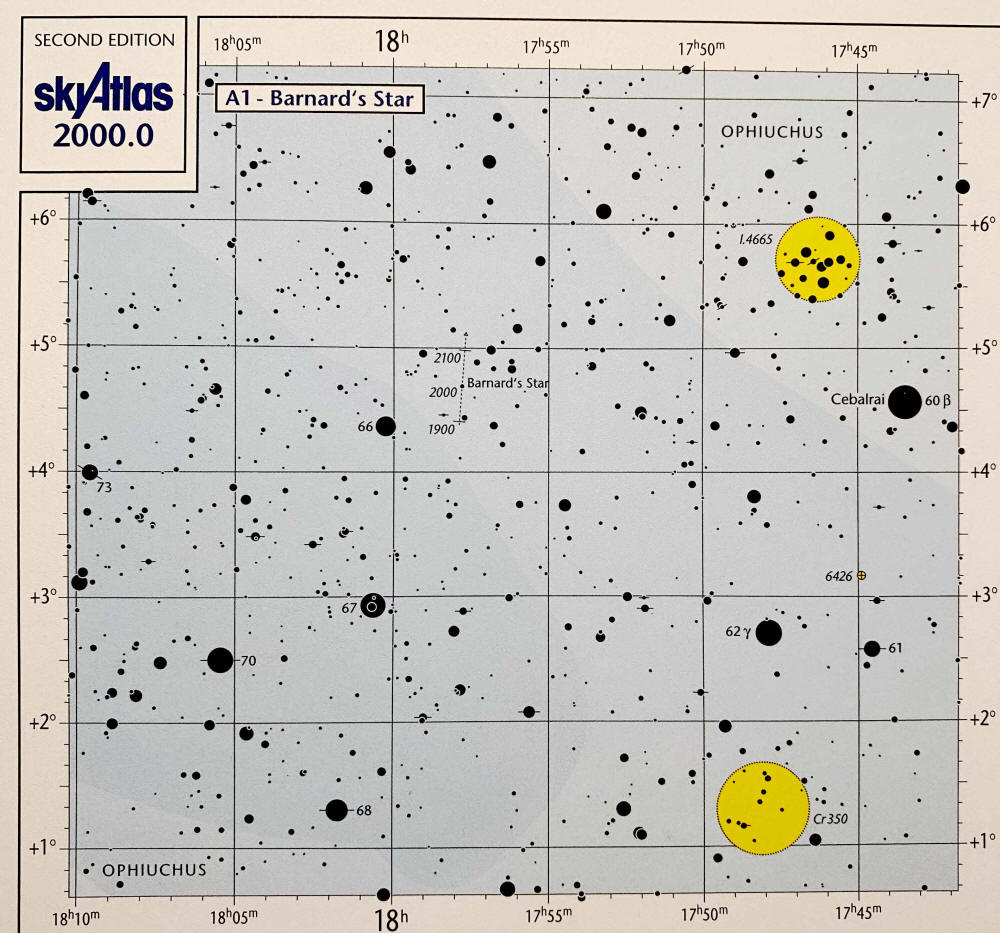
The chart below is an iPhone picture from
Sky & Telescope's SkyAtlas 2000, Deluxe Edition,
supplemental detail chart A1. It's an old-fashioned but
beautiful paper atlas with pages that unfold to 22″ wide x 16″
high. This supplemental chart was about 6″ square on a shared
page. The track of Barnard's Star is shown crossing the +5°
declination line, just west (right) of the 18 hr right ascension
line. Here's a
printable version at S&T.